Tuesday, January 30, 2024

Home Made Capillary Seal/Trap Experiment

This is my first home made capillary seal experiment. The setup is a 1/2 in burette filled glass beads of different sizes. 4 mm diameter color less beads for reservoir, and 1.5 mm black beads for the seal. The blue beads (2 mm) are used to keep the small light black beads from falling down into the "reservoir" section and from being blown upwards by leaking air bubbles. Column is filled with water dyed with red food coloring. Air is injected slowly from bottom using a air bulb.  

Figure 1. Setup of capillary experiment - burette tube filled with water colored red with food coloring, and different sized glass beads to represent reservoir, and seal facies (black). 


An air column of about 3 cm is reached when addition air injected start to leak above the seal. The air water contact fluctuated by about up to ±0.5 cm depending on rate of air coming up due to variable injection rate. Injection may also be pushing on the water below in the closed system.  However, the final air-water-contact did did not change for 3 hours after injection stopped.  

Figure 2, final steady state trap - 3 hours after injection stopped. 

Observations:

1) Capillary seal works even with a very porous rock - the sealing beads are 1.5 mm in diameter, and pore throats are probably at least 0.5 mm. I am guessing the porosity is 40% and peaceability is >100 Darcies. Yet, it is able to trap an finite air column below.

2) Leakage rate and injection rate are not quite same due to unsteady injection rate with the bulb. Injection may also be pushing the air-water-contact up in the closed system. This may have led to some fluctuation of the column height. 

3) However, the column height did not change with time once injection stopped as expected of a capillary seal. The final column is about the average of the entire session. This disputes the idea that capillary seal capacity is reduced after initial leak.   

4) Migrating air bubble/slugs often get trapped along the way (migration loss), and migration resumes when new air merges with trapped ones (Figure 2). As a result, the first bubble reached the trap after some volume has been injected. This is called "migration lag" (the time needed to fill these small accumulations / "saturate" the carrier). Continued migration requires continued supply.

Below is the video of one of the sessions. Sorry about the shaky video recording with my phone in one hand and the air bulb in the other. 


I am doing this because I feel too many geologists think that seals are impermeable, and leaking means seal failure. Capillary seal mechanism is the physical interaction of interfacial tension and pore throat diameter, and has nothin to do with permeability! For a given pore throat size, a finite column is trapped, and additional gas (or oil) leaks to maintain the balance of buoyancy and capillary entry pressure of the seal. Simple as that!

This is my initial test experiment and I have ordered a precision pump to be able to inject very slowly and other materials to improve the setup. Stay tuned for my next post!


Friday, December 29, 2023

Does HC Generation Cause Over Pressure and Micro-Fracturing?

First let’s estimate the maximum rate of oil generation in a geological setting. Lets take a very good source rock, with an S2 yield of 30 mg/gRock (5% TOC and 600 mg/g HI). That is 3% in weight of HC generation potential. Converting to volume, it becomes 6 to 10% of the rock volume, depending on HC density (eg. 0.06 to 0.1 m3 per cubic meter of rock). Lets take the high end, and assume a short oil window of 10 million years (most oil windows are longer), the rate of generation is 0.1m3 /10,000,000year, or 10-8 m3/ year, or 0.01 cc per year. Since a typical liquid drop contains 0.05 cc, this means in one cubic meter of rock, the source rock generates one drop of oil every 5 years

Now go on and think about how much pressure that generates, and whether this has any chance of making fractures in the source rock. Compare that one drop every 5 years rate with the 60 barrels per minute fluid injection rate we use to hydraulically frack the same rock.

Source rocks are quite "permeable" given geological time is 7 more more orders of magnitude longer than production time. Migration really does not require micro fractures. We have 10s of million years of time and a migration rate of only 0.0005 m/year is required to allow for the volume generated, creeping one pore space over a few years - at which rate, according to capillary number theory, it becomes a capillary dominated system, and viscosity (therefore permeability) does not even play a role.  

Even during gas generation, the volume increase is still minimal. Typical good marine source rocks generate only 10 to 20% of its potential as gas, and less than 30% including cracking of oil retained in the source rock. In situ gas density is lower, and volume may be 3 to 5 times of that for oil.  So we are still in the same rate range of less than 0.1 cc/year volume generated in 1 cubit meter of rock maximum.   

I do not believe these rates can cause micro fracturing, and do not believe micro-fractures are necessary for primary migration.  As HC generation happens almost uniformly everywhere in a mature source rock, fractures should be everywhere and in every mature source rock if they are required for expulsion/primary migration. We just don't see that, far from that. 

Core photo of Upper (A) and Lower (B) Eagle ford formation (Emmanuel Martin, 2013). Of all the core photos of mature source rocks I have seen, and I have been looking hard, vast majority of them do not have fractures of any kind. 

We do see micro-fractures in some source rocks, sometimes, most noticeable are those calcite filled "beef" like fractures are probably not caused by HC generation - but more likely formed during diagenesis before generation occurred. Micro-fractures are not present, or not pervasive in most mature source rocks, especially clay rich lacustrine and marine source rocks.  Occasionally we observe a few bitumen filled fractures but they tend to be a just a few, localized, not everywhere you would expect due to HC generation. Bitumen filled fractures are also not proof HC generation was the cause of the fractures. An simpler explanation of these is simply tectonic (especially shear) stress.  Some "fractures" in lab pyrolysis experiments are typically along bedding and probably caused by the thermal expansion of the rock during the experiments - even if we ignore the 13 orders of magnitude in heating (generation) rate.  Even at such high generation rate in the lab, Grohmann et al. (2021) shows that even 1 bar of vertical stress inhibits fracturing, as compared to the 100s of bars in geological conditions. 

References: 

R. Lenormand, E.  Touboul and C.  Zarcone, 1988, Numerical models and experiments on immiscible displacements in porous media, Journal of Fluid Mechanics 189(-1):165 - 187

S. Grohmann et al. Hyrous Pyrolysis of Source Rock Plugs: Geochemical and Visual Investigations and Implications for Primary Migration, 2021, IMOG conference paper. 


Does Over-Pressure Affect Seal Capacities ?

This may be the most controversial one I have ever posted. In this post I would like to challenge the widely accepted theory that over-pressure causes hydraulic fracturing in the seals and thus seal failure. I myself have taken this concept for granted during my entire career and have used it for basin modeling and petroleum system analysis for over 30 years. 

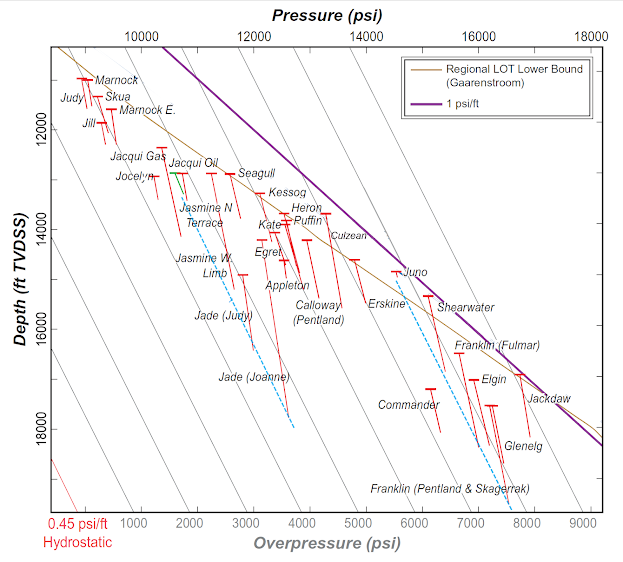
The figure below shows the reservoir pressure and HC columns in the HPHT area of the central graben in the North Sea. It is one of the most over pressured basins in the world, with over-pressures as high as 9000 psi above hydrostatic. First, there seems no correlation between pressure and the column heights. Some very large gas columns exist in the very over-pressured deep section. Pressures at top of some of the large gas columns exceed the regional LOP gradient and are very close to lithostatic!

Figure 1. Pressure and HC column data from the HPHT area of Central Graben, North Sea. Modified from Nygaard et al., 2020. Some of the reservoir pressures at top of gas column are above the minimum leak off pressure trend, and some approaches the 1 psi/ft (typical lithostatic) line.    

Many authors have mentioned hydraulic fracturing due to over-pressure may have caused some traps to have reduced columns, either not filled to spill, or have indications of a larger paleo-column, and some dry hole examples.  But such observations are common place in not so over pressured systems as well, and there can by many reasons not unique to over pressured systems. 

I have added the two dashed blue lines that connect several fields in what seems to be the centroid effects on several connected structures in a large fault block or compartment. This could explain the relatively lower pressure and large columns in the downdip parts of each centroid block. The centroid pressure transfer creates a condition that the seal has a higher pressure than the reservoir below. Several exceptionally large  (>1000 m) columns in several basins can be attributed to centroid effects.

Figure 2. Central North Sea aquafer pressure (hydrocarbon column pressures are corrected to water leg pressures).Central North Sea HPHT Pressure Cell Study, by Zimmer and Farris, 2021, Oil & Gas Authority

The second part of my challenge has to do with rates again. We can fracture the rock through leak off tests (LOT), or hydraulic fracking in unconventional plays. In figure 2, which include only water leg pressures, we see many cases of reservoirs pressures close to or at lithostatic pressure (1 psi/ft) and above the regional LOT fracture curve. 

In a LOT, fluid is pumped into the well bore at a typically 0.5 barrels/min and fractures initiate when pressure exceeds the rocks tensile strength in the lateral direction (σ3). The rate of pressure increase is at about 10 psi/min. In comparison, the pressure increase in the most rapidly buried basins is on the order of 0.01 psi/year (take the nearly 10,000 psi over pressure in figure 1 and assume all that happened in one million years). To add the pressure from buoyancy, if a 500 m gas column formed over a million years, that is 0.0005 m/year and also about 0.0005 psi/year increase in buoyancy pressure. We are talking about rates different by 8 orders of magnitude! And observation tells us, there is very little lateral pressure gradient in natural systems. We know deformation in geological times scales are more ductile, especially with the typical lithologies of seals - shales.

In addition, LOT is performed in a drilled hole, which strongly affect the stress and fracture characteristic of the formation. Stress concentration factor (Kt) is about a factor of 3 based on Kirsch's solution (E.G. Kirsch, 1898) for a circular hole in an infinite plate.  In nature such holes obviously do not exist, natural fractures (faults) are likely result of tectonic stress, and stress concentration is governed by structural geometry. 

This also means basin models that assume some "fracture gradient" below lithostatic based on LOT observations to bleed pressure off cannot explain this observation in figure 2. 

Note that the HC column has a higher pressure than water, and the difference is capillary pressure (Phc-Pw). If the reservoir is water wet, as most reservoirs are, the non-wetting phase HC pressure does not transmit to the rock matrix. This perhaps is why some of the columns can extend all the way to the lithostatic line. However, when the water pressure itself does reach lithostatic - there is no room for a HC column (such as Juno in the figure). And it would be very hard do drill in this situation.  This does not happen everywhere, perhaps only where large vertical relief structures drain from a deep depocenter. Centroid effect can cause the pressure in the shallowest structure on a connect trend to far exceed the background pressure. Structures down dip from such as high location may have a lower reservoir pressure than the overlying shale may trap larger columns than the capillary seal alone.  Fields downdip from Juno, Shearwater, Elgin, and Franklin (Fulmar, and Pentland) seem to line up on the same water pressure gradient.  The Jade (Joanne, Judy) and Jasmin trend seem to have a similar situation. 

I am also not aware of any observed hydraulic fractures in seals in over pressured areas. And I would like to hear any additional evidence that seals fail due to over pressuring. 

All petroleum accumulations are found below a seal, a layer of rock with tighter pore throats than the reservoir. This is true with tight reservoirs (unconventional) too (He and Xia, 2017). So the main mechanism of petroleum traps is capillary. The capillary force balance equation for column height , H = 2γcos(θ)[1/r-1/R]/g(ρow), has no pressure term (Purcell 1949, Berg 1975, Schowalter 1979). Any effect over pressure may have on capillary seal capacity would have to be indirectly on how it may affect pore throat size. We can assume over pressure can inhibit compaction, but it would be to a very minor degree compared to the range of pore throat sizes among the different seal rocks. 

Selected References:

Kirsch, E.G., "Die Theorie der Elastizität und die Bedürfnisse der Festigkeitslehre," Zeitschrift des Vereines deutscher Ingenieure, Vol. 42, pp. 797-807, 1898. (no I can't read German).

J. NYGAARD et all, 2020, The Culzean Field, Block 22/25a, UK North Sea, Geological Society London Memoirs · October 2020

WINEFIELD, P., GILHAM, R. & ELSINGER, R. 2005. Plumbing the depths of the Central Graben: towards an integrated pressure, fluid and charge model for the Central North Sea HPHT play. In: DORÉ, A.G. & VINING, B.A. (eds) Petroleum Geology: North-West Europe and Global Perspectives: Proceedings of the 6th Conference. Geological Society, London, 1301–1315.

Ole Christian Engdal Sollie, University of Bergen Master's thesis, 2015, Controls on hydrocarbon column-heights in the north-eastern North Sea

T. T. Schowalter, 1979, Mechanics of Secondary Hydrocarbon Migration and Entrapment; AAPG Bulletin vol. 63 (5): 723–760.

Berg, R.R. (1975) Capillary Pressures in Stratigraphic Traps. AAPG Bulletin, 59, 939-956.

Purcell, W. R., 1949, Capillary pressure--their measurements using mercury and the calculation of permeability therefrom: AIME Petroleum Trans., v. 186, p. 39-48.

He, Z and D. Xia, 2017, Hydrocarbon Migration and Trapping in Unconventional Plays, Search and Discovery Article #10968 (2017), AAPG Annual Conference Presentation.

Eva Zimmer, Matt Farris, 2021, Central North Sea HPHT Pressure Cell Study, Oil & Gas Authority.


Sunday, November 19, 2023

The Missing and Wrong Physics In The So-Called "Full Physics" Model

First this paragraph from George Box on "All models are wrong", "Since all models are wrong the scientist cannot obtain a "correct" one by excessive elaboration. On the contrary following William of Occam he should seek an economical description of natural phenomena. Just as the ability to devise simple but evocative models is the signature of the great scientist so overelaboration and overparameterization is often the mark of mediocrity".

That does not prevent some scientists try to include every thing they believe they understand, then promote their models as "full physics", not knowing many things in nature are not well-understood, or understood at all. Not knowing what is importantly wrong, they selectively worry about minor things that has no implication to the problem at hand. 

Are their models "full physics"? No, far from it. Basin modeling aims to model the physical/chemical/geological processes in hopes of better understanding these processes. However, we don't yet fully understand many of the processes, some important processes are obviously not accounted for in some basin models. Below I list some important physics that either are missing from current basin models, or are not correctly implemented. Hope this servers a reminder when you hear "full physics" marketing ploy again next time.

Migration modeling: Some Darcy flow migration models lack some well-known physics between saturation and capillary pressure, and as a result, oil accumulations occur in places without a trap (!!), or accumulations with unrealistic saturation distribution - Have you ever seen a 2km vertical HC water contact (??).  Also note the total column of the trap is 3 km!! Has anyone ever seen it exist in nature?

Figure 1. Darcy migration model without proper physics between fluids and rock. Saturation distribution is very unrealistic, and geologically impossible.  

Wrong rifting heat flow: Some so called full physics models still have the wrong idea about rifting and heat flow. Below is a heat flow model (red curve) of an area with a beta factor of 2. Notice the heat flow started at 32 mW/m2 (which is a unrealistically too low for any continent, especially where this basin is - Australia which has one of the hottest crust!), and at the end of rifting it doubled, and then over the next 100 million years it cooled off to 36 mW/m2. What's wrong you may ask? It is wrong because the model does not account for the fact that crust produces more than half of the heat - so attenuation of the crust by rifting will cause loss of heat production. Because of that, the heat flow at present day should be lower than before rifting!  But this model shows the opposite! 

Figure 2. Rift heat flow history from a certain "full physics" model that does not account for the loss of radiogenic heat production (RHP) by crust attenuation from rifting. 

Compaction: The compaction model is an essential part of modeling burial history and over-pressuring.  Current models assume a unique porosity-effective stress relationship that was first developed from soil mechanics. This is not appropriate as over geological time rocks are not elastic and continue to creep/lose porosity under the same load (effective stress), as evidenced by much lower porosity in older rocks, compaction curves correlate with formation age, etc. The immediate effect of not accounting for the effect of geological time is that it is very hard to maintain overpressure once loading stops, or with uplift and erosion. Almost all the unconventional plays have experienced uplift and still maintain significant overpressure.  

HC expulsion fractionation: Some researchers attempt to use the composition of fluid generated by lab pyrolysis for the initial composition of fluid expelled from the source rock in basin models. This ignores the observation that fluids found in source rock extracts are VERY different from fluids produced from accumulations - many things are happening between generation and accumulation that are not accounted for in basin models. It is pretty obvious that heavier HC molecules are preferentially retained by source rock (perhaps due to preferential adsorption), so the expelled fluids are much lighter, and higher GOR. A good reference on this is this study by Sonnenfeld and Canter, 2016   Many of us recognize the problem, but we don't have the physics worked out.  

Migration fractionation: At the typical depth petroleum fluid is generated, oil and/or gas are single phase. As migration of the fluid upward reaches bubble or dew point pressure, it separates into a vapor (gas) and liquid phase (oil). The two fluids now have very different composition - light liquid goes with the vapor phase, and the remaining liquid becomes lower GOR and lower gravity. In an oil dominated system - we find heavier, low GOR oil (than what was generated) in shallower reservoirs because of this. They are not what the source rock had generated. Same happens to gas systems. Migrating gas loses heaviest liquid first, so the remaining condensate gets lighter as the gas gets drier (higher GOR). See this post on observations. Loss of polar components along migration path due to adsorption on minerals has not been accounted for in models. 

Even during early single phase migration, the effects of composition grading ( observed compositional gradient in accumulations) especially in near critical conditions, in a fill-spill trap is that the spilled fluid is lower GOR and lower gravity, that the total fluid in the trap.   

This is not accounted for in basin models and it is not a good idea to think that basin models can predict fluid properties without accounting for this (thermodynamic) process. 

Using Heat flow as boundary condition: Many modelers use heat flow as the boundary condition at the base of sediment for modeling the temperature history.  This method ignores the effect of growing the sediment column has on heat flow itself. Adding sediment column moves the surface further away from the LAB (1300 °C). It lowers mantle heat flow by increasing dz in the equation Q = K*dT/dz. It also ignores the transient effect as the entire lithosphere now requires new equilibrium.

Figure 2. The effect of adding 1 km of sediment to the lithosphere column.  The red arrows show temperature increase required for new equilibrium. It is often mentioned that the new sediments need to warm up. But we cannot ignore that the rest of the lithosphere (~100 times the rock volume of the new sediments) also needs to warm up, on average 15°C, for every 1000 m of new sediment. And that is going to take a much longer time. And you can see that the new profile is a lower thermal gradient and thus lower heat flow.

Full lithosphere models show that rapid burial can reduce heat flow by 30% in some cases, depending on burial rate. This is physics that can be modeled correctly, but not if we assume some "basal heat flow" through time independent of the physics. To  account for this physics, a proper thermal model should use a boundary condition at the base of lithosphere. 

Relationships: Many of the functions, relationships used in basin models are empirical - which is not physics. A simple example is the permeability-porosity relationship below. There is no direct relationship between the two physically. Permeability varies by several orders of magnitude at the same porosity - even for the same rock type, same formation etc. Empirical models can be useful in many ways, but the uncertainty cannot be ignored - but basin models  often use these relationship to model fluid flow, pressure prediction and HC migration without addressing the huge uncertainty.

Relationship between porosity and permeability for porous rocks- modified from Ma and Morrow, 1996, 

Upscaling: Due to limited computation power, cellular basin models use grid cells on the order of 10s to 100s of meters in thickness. If we take a look at 100 m worth of well-log, or outcrop, how often it is entirely homogeneous ?  I think you can imagine petroleum migration thorough a homogeneous rock volume is entirely different from some sand-shale interbeds. I have not seen any published attempt at upscaling Sw-Pc curves of interbedded different rock types.  

We simply don't' have enough data for migration modeling. A parallel problem  is that seismic does not have the resolution for mapping the plumbing system to which the physics apply, for us to upscale from, not even close. We don't actually know the number of interbeds and their lateral distribution from the standard seismic interpretation - let alone all the properties of these rocks, such as the different Sw-Pc curves for each type.  Well that is even if you model actually implemented a Sw-Pc relationship in the first place.  If you are interested in this topic, you may want to look up the concepts of the Leverett-J function and FZI and HFU.       

Biogenic gas: The formation of biogenic gas is not well understood - especially when it comes to quantifying the volume. That does not stop vendors from making up a model for you (and charge you a lot of money for it). The current model assumes that the process of biogenic gas generation consumes part of kerogen - and asks you to input some equivalent TOC and a convertible fraction that is the source for biogenic gas. Well - that is not physics - the volume you are getting from these models are based on assumptions, so it is no different than you are assuming you know how much gas is generated per volume of rock - it is not based on any real science!    

Assumptions, assumptions:  Many assumptions are made in the traditional basin modeling, often an assumption is made just because we don't know it well not because it is insignificant. Yet we will forget that assumption when we discuss the result of the model. I will add some examples later. 

Conclusion: Don't be fooled by a fancy colorful 3D model, its usually not very useful. We actually don't need a full physics mode, we need something simple but when applied can answer important questions in exploration quickly. 


Friday, November 17, 2023

Are Faults Necessary Migration Conduits? A Simple Migration Model Says No.

We often observe petroleum accumulations in association with faults, especially in deltaic systems (Gulf coast, Niger delta, Mahakam delta, Nile delta ... and rift systems (Most basins in South East Asia, North Sea ...). Often in the literature the assumption is made that the faults act as path ways for migration up such systems. Here I make a simple argument that migration via faults is not necessary, or even possible in order to explain the distribution.  

This cross section is from the Hindel field, in Mahakam delta, Indonesia. Some obviously active faults cut through the large number of stacked oil and gas reservoirs.  This is very typical of deltaic systems. Question is, did the oil and gas migrate up the faults to charge these reservoirs?


Figure 1. Cross section through Handil Field, Mahakam delta, Indonesia, Antony Reynolds, 2016. There are some 500 stacked reservoirs vertically.


I have made a very simple model of the geology in Trinity (our popular 3D migration modeling software). There are only two (yes only 2) variables in this model. Capillary displacement pressure, Pd, and buoyancy. The faults are assumed to have a higher Pd than the shales, meaning NO migration along or across the faults. Oil is injected from below the field where the source is at. As the column of each accumulation grows and exceeds the capillary displacement pressure of the shale above, migration continues through the shale and into the next reservoir. It is amazing that such a simple model can explain the distribution of petroleum pools so well. So the first obvious conclusion is that the faults are NOT necessary to act as conduits for the filling of the reservoirs. In fact, if we allow migration along the faults, we could not form the accumulations.    

Figure 2. Simple capillary model to explain the accumulations in stacked reservoirs in a deltaic system. The faults are sealing.

With the high net to gross in this field, it is very conceivable that juxtaposition of sand on sand may allow migration across the faults. Below I made some of the sand-on-sand locations low capillary pressure so migration across faults is allowed. The patterns are a bit more complex and the main difference is that the shallow reservoirs between the faults are charged in such a case, compared to figure 1. 

Figure 3. Same as figure 2, except migration is allowed through some of the sand-on-sand juxtapositions. This is by lowering the capillary pressure of the faults at the juxtaposition locations. 

The second one is more reasonable compared to the actual field. Also keep in mind this is only a 2D model. Vertical migration may happen in different locations, and lateral migration along structure strike is also possible.  

An important observation I have made of similar fields in many basins that the sands in between large faults in these compressional flower structure are less frequently charged. I interpret this as indicating although cross fault migration is possible, but less frequent.  The faults are acting as barriers and thus creating migration shallows for vertical migration.  

I have paid attention to these observations to get a better understanding on migration. And I have always been able to explain them with a simple capillary model like this. This applies to stacked reservoirs in 3 ways against salt as well. 

A lot of papers mention faults are migration conduits, without further elaboration. In discussions I have had with colleagues and friends, I find that more than 50 of us would invoke faults as migration conduits. Some go as far as to believe no charge of shallow reservoirs is possible without faults. But when asked how can the oil come up the faults and fill a reservoir, but not leak up the fault the same way it came (both sealing and leaking). The answer is usually more strenuous and unconvincing, and usually involves some exotic episodic behavior. 

I think the main reasons geologists like to invoke faults for migration are 1) accumulations are often associated with faults, and 2) there have been a misconception that shales are "impermeable". The association argument works both ways, and the opposite is that faults act as seals so 3 way traps can be traps. The permeability is never zero for a shale, they are often quite permeable, and low-permeability is not the reason that oil is trapped below a shale, it is the entry pressure that is holding the column. Entry pressure is a finite pressure and can only hold a finite column. Additional oil will simply leak through.   

Since the simple assumption that faults are seals (vertically and laterally) can explain the distribution of accumulations beautifully, I suggest we stick to an Occam's Razor model.

I am not ignorant of anecdotal evidence for oil migrating though faults, most obviously the seeps along faults at surface, bitumen filled faults, among others. But for forming large accumulations that we observe we should assume faults, in most cases are sealing. If we look at accumulations in basins across the global, we can hardly find any fields that don't have faults across the structure - if faults are leaking, and not leaking, we would have no predictive power. Some of these have been there for many millions of years.

There, I said it. 


Migration and Trap Filling Models

This post compiles some of the images from my recent posts on LinkedIn, to show the important role capillary pressure plays in petroleum migration and trap filling. These models assume that migration rate is extremely slow, limited by supply rates from the source rock, and thus migration is always in equilibrium with the capillary pressure field of the geological system - the dynamic effects of viscosity (thus Darcy flow rates) can be safely ignored. In fact we have never observed any distribution patterns of petroleum pools that can not be explained by capillary pressure alone. All accumulations are constrained by a capillary system, except occasionally hydrodynamics and gravity (tar sands) play a role in part of the accumulation. The variation of pore throat sizes laterally due to facies change, and vertically due to different lithologies is the greatest force that controls the migration process and the distribution of petroleum pools - at all scales microscopic to 100 km+ scales, and tight reservoirs to the traditional traps.    

These models use very simple geological models to demonstrate the useful physical principles, and real world geology is much more heterogenous and variable - we need to have in mind what we see in cores, on logs, and in outcrops when we make models. Models are useful because they help us understand the physics, and interpret observations, and make predictions, with the difference between nature and model in mind.  


Figure 1. Capillary displacement pressure, and Sw-Pc (Sw-Height) curves are fundamentally what control the trap filling process, and the resulting saturation profiles, and the variable oil water contacts. 

Figure 2. The saturation distribution in the model above. Saturation is a function of both height above FWL (ie. capillary pressure (Po-Pw), and the rock type. The low saturation occurs in tight rocks thus volume is reduced by both porosity and saturation.  


Figure 3. An idealized model to show OWC can be tilted if a systematic change in pore size exist across the entire field. Observation of a tilted, or variable OWC is not always due to hydrodynamics. When studying tilted OWCs, we should investigate not only the pressure gradient, but also capillary data, which can be inferred from porosity/permeability data. The Tin Fouye Tabankort (TFT) field in Algeria may be such an example.

Figure 4. A model demonstrating the mechanism of stratigraphic traps after Tim Schowalter 1979. Note that capillary seals are relative - a trap is formed when a tighter rock is above or up dip of a less tight rock. So reservoir rock of one accumulation can be the seal for another accumulation. In nature these changes are more subtle and hard to draw the boundaries. The main observation of these mechanisms are the correlation between saturation and rock quality.  


Figure 5. The purpose of this model is to demonstrate the effect of storage along migration pathway on the distance of migration for a given volume generated by the source rock. The poor reservoir (silty, or shalely) stores less along the carrier, and the result is that same volume of supply will travel further in the same time that volume is generated compared to a better quality carrier bed - everything else being equal. Effective carrier beds do not have to be very good quality.  

Now a couple of real examples:


Figure 6. The Parshall field on the eastern side of the Williston basin. The middle Bakken reservoir gradually thins to the east with lower porosity and permeability. The field does not reach the actual pinch out of the middle Bakken. This model shows that the gradual change of the middle Bakken facies is responsible for the trap, rather than the pinch out. This is probably true with many of the subtle accumulations elsewhere in the Middle Bakken, and in other unconventional plays. The traps are subtle!

Figure 7. The Kraka field in the Danish North Sea has a tilted FWL. This is a quick model to show how it works based on data from this paper.


Please feel free to use these images in your research or teaching. You may reference the petroleum system blog, by Zhiyong He, founder of  ZetaWare Inc. 

Key references:

T. T. Schowalter, 1979, Mechanics of Secondary Hydrocarbon Migration and Entrapment; AAPG Bulletin vol. 63 (5): 723–760.

T. T. Schowalter and P. Hess, 1982, Interpretation of Subsurface Hydrocarbon Shows;
AAPG Bulletin, V66, No.9, pp. 1302-1327

P. Frykman et al., The history of hydrocarbon filling of Danish chalk fields, Geological Society London Petroleum Geology Conference series · January 2004


Monday, November 6, 2023

What Is Migration Lag & Why Timing of Generation Is Not Important

 As a source rock begins to generate oil and gas, the generated HC fluid cannot just leave the source right away, it will first need to saturate the kerogen's adsorption capacity, which depends on the total organic carbon (TOC). The volume retained by adsorption can be a significant of the generative potential - 20% for a good source rock, and 50% or more for a poor one. This can be estimated by the extract of petroleum/bitumen in the source rock. After that, additional volume generated may be trapped within the pore systems (especially if the source is heterogeneous - with interbeds of  shales, limestone, marls, and silty interbeds) of the source rock as we see in shales that we produce from, and this can be very significant, also on the order of up to 50% of the generative potential of the source. There is no secondary migration up to the time until the saturation induced capillary pressure is high enough to allow primary migration out of the source rock. 

Secondary migration first occurs in "first carrier beds", which are layers of more porous beds directly above, or below, or interbedded with the source. In the carrier beds, it forms accumulations in structure (3, 4 ways) and stratigraphic traps, large and small (down to pore scales), that need to be filled before migration continues, either leaking up wards, or spilling out side of the mature kitchen. Since this happens near the source rock, the lateral extent is as large as the kitchen/fetch area. This consumes a large volume, up to 100% of the generated volumes, and the time it took to generate this additional volume. 

There can be additional carrier beds, and large and small traps that need to be filled before HC fluids finally reach our target trap. All of these cause the delay of charging the traps we want to drill. This delay/lag is a function of the volume of all of these traps (also called hotels, motels) between the source rock and the target trap. This lag explains in many basins where oil is found in traps that formed up to 10s of millions of years after oil generation occurred, such as the oil fields in the West of Shetlands basin:

Typical burial history of of the kitchen area for the Faroe-Shetlands basin. Despite oil generation from the Jurassic source rock (green start) occurring mainly in Cretaceous time, the lower Tertiary reservoirs (yellow start) are filled with low GOR black oils (eg. the Foinaven and Schiehallion fields). This was explained as migration delayed by first "moteling" in deeper traps, Scotchman et all 2006.  

HC migration does not stop when the source rock is exhausted as we might expect. This is because the volume of HC fluids trapped in these deeper traps (hotels) continue to mature - cracking from larger molecules to smaller ones, and gas oil ratios (GOR) continue to increase. This volume increase can be larger the the volume generated by the source rock. Continued compaction, diagenesis also reduce the size of these hoteling traps, and cause additional migration. This is why we are seeing very young traps being filled very recently, long after the source rock is spent. 

Schematic explanation of migration lag. Note that the present day condition of a basin/area could be at one of these stages. The target shallow trap has not been charged yet if the system is at stage 2 at present day, although the source rock is mature.  It should be obvious that the hoteling traps directly above the source should be the main targets in all stages.

Some times, or should I say very often,  the hoteling traps are so numerous, or large that generated volume is entirely consumed by them, and the traps above them we are targeting don't get charge at all. One very useful observation, globally, is that exploration targeting the hoteling traps (first carrier beds) are very successful - in fact - 80% of more of the world's petroleum reserves are found in these (Lower Cretaceous reservoirs of western Siberia, Jurassic/Cretaceous reservoirs in the Middle east, Middle Jurassic in the North Sea below the source rock, Wilcox play in deep water GoM ... ..., ). Success rate exponentially decreases for traps further up stratigraphy. 

Unconventional plays are essentially the hotels that we are now and producing from. East Texas field, Giddings Field are conventional reservoirs and the oil was generated and migrated from the Eagle Ford. The Eagle Ford retained about 15 mmbls/km2 of oil, which would have to be filled first before migration toward the conventional fields happened.  The Woodford, Meramec would have to be filled before oil could migrate northward to North Oklahoma and Kansas. 

Note that the original notion of hoteling/moteling may imply that some tectonic movement is necessary for the hotels to spill at a later time. This can happen of course, but more generically it is not necessary. Generation and cracking to lighter fluids is continuous, and volume expansion of HC trapped near the source is continuous, once a hoteling trap is filled, it will continue to leak/spill, porosity loss in the hoteling traps continues, all as long as the burial continues. In rift basins like the FSB, the thermal subsidence and the associated tilting toward the basin center, therefore spilling up-dip, is continuous too. 

More generally speaking, every trap is a hotel, while being filled, it causes a migration lag for the next trap in the chain of spilling or leaking. We can only drill and produce economically a limited number traps in a basin. The deeper, non-economical ones are then referred to as hotels, or migration losses. But they are all over the kitchen area and contain much more volumes. In some shallower basins we are drilling and producing from traps near the source and the source rock itself (unconventional). The Eagle Ford contains more oil and gas that ever been found in conventional traps sourced from it. Back in time, these conventional traps up dip had to wait until Eagle Ford itself was filled. The distribution of HC volumes in a basin is a pyramid stratigraphically speaking. The base is the source rock, and the bottom 1000 meters typically contains more than half the volume, and often > 90%.     

Further reading:

Scotchman, I; A. D. Carr and J. Parnell, 2006; Hydrocarbon generation modelling in a multiple rifted and volcanic basin: a case study in the Foinaven Sub-basin, Faroe–Shetland Basin, UK Atlantic margin 


https://www.searchanddiscovery.com/pdfz/documents/2017/42014he/ndx_he.pdf.html


Saturday, September 23, 2023

Predicting Oil vs Gas in a Mixed Oil/Gas System

Fluid phase (oil, gas, oil and gas) in traps are usually not what the source rock has made through maturation process, and often far different from it. This is because of expulsion fractionation, migration lag, mixing of fluids from different sources, and phase separation during migration and entrapment (leak, spill) etc. Typical BPSM modeling does not model most of these processes correctly, or at all. 

In a D/E (deltaic coals as source rock), or a system with multiple source rocks, the most useful concept comes from Sales 1997 paper, that fluid phase often is controlled by  trap closure and seal strength, as shown in this figure:

In a dual HC phase system (reservoir pressure < Psat), if a trap's closure is less than the maximum column of gas the seal can hold, it will spill the oil phase and contain only gas (class 1). If the seal strength is less than a full oil column, it will retain the oil column, and leak off the gas (class 3). If closure is greater than the maximum gas column but less than the maximum oil column, it will end up with both phases (class 2). After J, Sales, 1997. 

Structure closure is often known at time of prospecting. Seal strength is not, nor is the fluid entering the trap, so the method we use is a Monte Carlo model that describes the unknow parameters, most importantly seal strength, GOR of incoming fluids (which depends on source rock type, maturation and migration process), and the saturation pressure of the fluids, with a distribution. The outcome of the modeling (Trinity software) is a probability of fluid type for each prospect/trap. 
 
The classic examples are found in deltaic basins in South East Asia. The discovery of Kikeh field rekindled the talk on this concept. Not too far, in the Mahakam delta, Kutei basin, Indonesia, there are several large/giant fields that are perfectly explained by this model. The structure closures range from 10s of meters to greater than 500 meters. The source rock is deltaic and fields are a mix of oil, gas and oil/gas. The figure below shows the model prediction using the same assumptions on 4 different fields. 

Trinity 3D phase risking results of four fields along the cross section (blue line) with same input parameters on charge (1000-10000 scf/bbl) and seal (25 to 120 psi seal Pc). Only variable is closure height among the traps. Map courtesy of Ramdhan and Goulty , 2018

It is important to note that the results are very good and not so dependent on the incoming fluid type. With the typical seal strength, the traps can be charged with 1500 scf/bbl black oil, or a 15,000 scf/bbl gas condensate, the end results is nearly the same. The high relief structures consistently yield oil phase or oil phase with a gas cap, and vise versa, that low relief structures are most often end up with a gas phase.  

I make this post because It seems to me that the last 25 years since the paper was published, there have not been enough application of this simple and very useful concept. Now we have a map based risking tool for easily making such predictions. Hope this will get more application of this unbelievably useful concepts.   

Discussions:


To be more generic, we can describe Sales classes mathematically between capillary entry pressure, fluid density and trap closure. For any given structure closure that is in the two-phase region (reservoir pressure below bubble or due point) of a petroleum system, the seal capacity dictates which phase ultimately remain in the trap, assuming charge volume is sufficient. 
Where, Pc is the capillary seal capacity of the shale, H is the closure (crest to spill point) of the trap,
w, ⍴o, and ⍴g are the in-situ densities of the water, oil and gas columns, respectively. 

Class 3 traps may often include a small gas column due to differences in interfacial tension between oil-water and gas water. Theoretically this may be 15 to 20% of the column see earlier post here. Some class 3 traps offshore Sabah (Kikeh and nearby fields) have variable small gas caps in stacked reservoirs. 

In the real world, many factors can affect the contacts and phase proportions, faults are prevalent in deltaic systems and can complicate leak/spill/closure relationships greatly, especially 3 way traps. Column may be dynamic from both rate of charge/leakage and changing composition of charge where gas is often not equilibrated with the oil column below. There is rarely enough data to validate, let alone predict such details before drilling.  However, for exploration purposes, Sales' concept, especially when combined with our probabilistic approach hold very well against observations. It is possible to include considerations of non-capillary seal, faults, and other factors in the input distributions. 

References:


Sales, J.K., 1997, Seal strength vs. trap closure ----, fundamental control on the distribution of oil and gas, in R.C. Surdam, ed., Seals, traps, and the petroleum system: AAPG Memoir 67, p. 57-83

Ramdhan1, A. & N. R. Goulty, 2018, Two-step wireline log analysis of overpressure in the Bekapai Field, Lower Kutai Basin, Indonesia. Petroleum Geoscience online article.


Sunday, June 18, 2023

Phase Behavior of Mixed Petroleum Fluids

I came across this phase diagram recently and like to explain what I see. What is this fluid, what are the likely properties, and what geological processes may have created it? I posted on LinkedIn as a question and had many good suggestions that I have incorporated in the explanation below. 

1) It is obviously a gas (vapor) reservoir by definition (reservoir temperature > critical temperature), and a retrograde one (reservoir temperature < cricondentherm), definitely not an oil. See definitions of fluid types in the blog post just below. 
2) It is not a normal retrograde condensate. First, the critical point is at -92 °C, that is colder than pure methane (perhaps some nitrogen may be mixed in there)! So it is a lean gas. The actual C6+ is only about 2 mol% - so it is actually very dry.
3) The cricondentherm (the highest temperature on the curve) for a normal dry gas should be near 0 or negative, but this one is at 380 °C! That is a cricondentherm for a black oil. High cricondentherm means it takes very high temperature to vaporize the liquid in this fluid - so it must be fairly heavy hydrocarbons. 
4) The dew point pressure is abnormally high at ~8000 psi. High Psat gas means either it has a lot of liquid (rich), and/or the liquid fraction in fluid is hard to dissolve in the gas.
5) We can rule out rich liquid case because the critical temperature is too low for that a rich condensate. 8000 psi is also too high for that too. So it is likely a mixture of a lean/dry gas with a liquid that is much heavier than normal condensate. 
6) In this particular case, it is a dry gas sourced from a coal mixed with small amount of lacustrine oils. The "condensate" is around 35 API gravity! 
7) Very high saturation pressure (some times > 12,000 psi) is a good indicator of a mixed fluid that came from very different sources. We see this in the GOM deep water, and the Mediterranean Sea, where we have mixes of biogenic gas and some normal oil. We also find these on both side of Atlantic margins, and some deep basins in China. It is one of the clues for some of the fluids offshore Guyana/Suriname.
8) This could also be a result of a dry gas with oil based mud contamination , as proposed by Brian Moffat in the LinkedIn comments section. So be careful.  

The figure below explains the effects on phase diagram when a dry/lean gas is mixed with a normal oil. 

Fig. 2. Effects of mixing dry gas with normal oil on phase diagram. Dry gas has a very low critical temperature and cricondentherm. Black oil has very high critical temperature and cricondentherm. The mixed fluid inherits the low critical temperature from the gas, but the high cricondentherm from the oil. The saturation pressure increases dramatically as the two fluids are not compatible. It takes higher pressure for them to dissolve each other.  


Thursday, June 15, 2023

Petroleum Reservoir Fluid Types

The five main type of reservoir fluids, black oil, volatile oil, retrograde gas, wet gas and dry gas, are used mainly by engineers for designing production facilities based on what is expected to happen to the fluid during production. It is often confusing to geologists as we tend to focus on the range of properties of each fluid type, such as API gravity, GOR and color etc. offered in literature tables like this one: 

However, the classification does not actually depend on these properties, instead it depends on the fluid's phase behavior and initial reservoir PT conditions. The same exact fluid can be a retrograde gas, or a volatile oil simply due to a few degrees difference in reservoir temperature. A fluid may be retrograde gas at a given reservoir temperature, but a wet gas if the reservoir temperature is higher. These typical ranges of properties are only a guide. In nature some gas fields have heavy condensates (<40 API gravity), whereas some black oils are colorless and very light (55 API). I hope this essay can help the PSA community in their petroleum system evaluation and communicate with engineers and managers better.

Fig. 1. The standard fluid types are determined by the position of the initial reservoir PT condition relative to the fluid's critical point, cricondentherm and separator conditions. The color circles on each line is the critical point. The large blue dot is the initial reservoir pressure and temperature. The blue line indicates how reservoir pressure decreases during production. Tc -  critical temperature, Tct - cricondentherm, Pd -- dew point pressure, Pb -- bubble point pressure.

The standard fluid types are determined by the position of the initial reservoir PT condition relative to the fluid's critical point, cricondentherm and separator conditions (Fig. 1). If reservoir temperature is lower than the critical temperature of the fluid it is oil (liquid), and when pressure drops it will cross the bubble point and thus also called a bubble point fluid. If the reservoir temperature is higher than the critical temperature, it is a gas (vapor), and also called a dew point fluid. Black oil and volatile oils are separated by the shrinkage factor (FVF) ; Among the gas types, it is called retrograde gas if condensate can form in the reservoir (Tc < T < Tct). If condensate cannot form in the reservoir (T>Tcc), but can in the separator, it is called wet gas. It is dry gas if no liquid drops out at the separator or surface. 


Black Oil is a bubble point fluid whose critical temperature is much higher than the reservoir temperature (Tc>>T).  It is "low shrinkage" - with FVF (or Bo) less than 2 due to low GOR. It is usually black hence the name. 
Volatile Oil is also a bubble point fluid (Tc>T). But the critical temperature is closer to reservoir temperature. It is high shrinkage (FVF > 2.0) due to higher  GOR and volatile because it has higher content of C2-C6 hydrocarbons.
Retrograde Gas (or Gas Condensate) is a dew point with critical temperature less than reservoir temperature (Tc<T) but because cricondentherm is higher than reservoir temperature (Tct>T)  condensate can form in reservoir when pressure drops below dew point and cause production problems. However, condensate volume decreases again (retrograde) when pressure is further reduced.   
Wet Gas has a dew point as well, but because reservoir temperature is higher than the cricondentherm (T>Tct), condensate cannot form in the reservoir when pressure decreases. However, because the separator PT condition falls within the phase envelope, condensate will form in the separator and has to be dealt with. 
Dry gas has so little C7+ that the condensate will not drop out in the separator or even at surface. 

Exceptions and odd fluid properties


The properties of fluids within each type can be outside or typical ranges given in the table above. There can be a black oil with no color, and 55 API gravity. Some gases may have a low gravity and dark colored condensate.  

The boundary between black oil and volatile oil is not so clear cut with parameters. GOR for volatile oils can be as low as 1000 scf/bbl, and black oil up to 2000 scf/bbl, depending to a large degree on the concentration of C2-C5 hydrocarbons vs methane.  The solution gas for black oil stays in gas phase in the separator, and simple mass balance equations (black oil models) are adequate. Solution gas from volatile oils drops condensate in the separator, and requires more sophisticated EOS models. 
Fig. 2. Normal relationship between API gravity and GOR. Fluids outside of the normal trend are likely formed under certain geological conditions, that may not happen to most fluids.

Certain geological processes can create unusual fluids. For example, when a gas condensate migrates into a low pressure reservoir, the light gravity condensate drops out and forms an "oil" rim. If the trap then leaks off the gas cap, or if the oil rim migrates into another trap, we can end up with a low GOR black oil but very light (something like 300 scf/bbl & 55 API). Water washing can cause a gas condensate to lose most of its gas and form a black oil as well. These “black” oils are light colored or colorless. The laminaria fields (fig.2) are black oils interpreted as formed by water washing of an originally gas condensate fluid. 

The opposite can happen when mixing very different fluids. We are now drilling much deeper (higher pressure) than before.  A migrating undersaturated gas may dissolves a small amount of normal or even heavy oil during migration, either from background organic matter, or small oil accumulations. The result can be a gas reservoir with a condensate API gravity in the black oil range. Such fluids have abnormally high dew point pressure and cricondentherm, so they likely fit the definition of retrograde condensate, but GOR can be in the dry gas range. 

Abnormal fluid properties can be clues to the geological processes, and the interpretation can be useful in petroleum system analysis and prospect evaluation. 

Other names

Gas condensate often has the same meaning as retrograde gas, but also a more generic term that include all gases because all natural gases have some amount of condensate, however little it may be. Sometimes is is also called condensate gas.
Rich gas condensate is one that contains more condensate. At a GOR of 5000 scf/bbl, a million cubic feet of gas yields 200 barrels of oil (condensate from the gas). The mass fraction of the two are about same (50% each), but both dollar and calorific/BTU value of the condensate are more than that of the gas. Even at the GOR of 20,000 scf/bbl, the 50 barrels of condensate at $70/bbl, is worth more than 1 mmcf of gas at $3/mcf. For us geologists, we need to be aware that rich gas condensate can only be found at deep enough reservoirs. 
Super critical fluid, is gas condensate (but typically refer to liquid rich ones) when reservoir pressure and temperature are higher than critical point. These have properties between gas and oil and some times called dense fluid. Near critical fluid can also include volatile oil.  

References:

William McCain, The Properties of Petroleum Fluids, 2nd Ed., 1990


Friday, April 22, 2022

Petroleum Migration Rates and Distances

 In my training classes, I am often asked about the rate and distances of oil and gas migration. There seems to be much confusion in understanding how petroleum migrates, and the controlling factors. 

Migration Distance

Long distance migration are observed in many basins. Here is a list of basins I am familiar with:

  • Athabasca field, Alberta basin, Canada > 700 km from the kitchen
  • Orinoco oil field,  Venezuela, > 100 km  
  • East Texas field, Texas, USA, > 100 km 
  • Wolfcamp accumulations near outcrop in central Texas, Permian basin, > 200 km.
  • Rubiales field, Llanos basin, Colombia > 100 km
  • Mississippi oil trend in Kansas, Anadarko basin, > 500 km 
  • Ghawar field, Saudi Arabia, > 200 km. 
All of these are from Foreland basins or continental sags which have marine depositional systems with good vertical seals, and the structure relief is too low to allow vertical migration. Another requirement for long distance migration seems to be the source rock - enough petroleum needs to be available to feed the migration chain.  

Below are two figures from the Anadarko basin in Oklahoma and Kansas.

Figure 1. oil and gas wells in the Anadarko basin. The accumulations in Kansas are 100s of kilometers north of the Woodford kitchen in southern Oklahoma. The oil production trend (a giant "river" of oil migration) continues further north into Nebraska.  


Figure 2. Map location of wells in the Anadarko basin, showing patterns of migration into Kansas and beyond. The orange outline is the mature kitchen of the Woodford shale, which is the main source rock for the oil in the basin. There is also production in Nebraska, Colorado that are not indicated here.

Large vertical distances are associated with very good source rock potential and the geological controls that limit lateral migration (such as high structure relief, faults, and salt), and may be then limited by the thickness of the sediment column. In the GoM basin discussed above, sea bottom seeps are very common, the source rock is 10 km below surface. 

Migration Rate

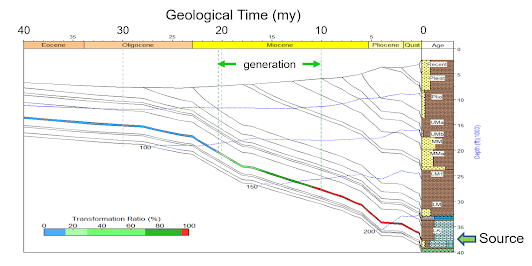
Below is a typical burial history diagram from deep water of Gulf of Mexico basin. It shows that the "oil window" is roughly 10 million years. The Tithonian source rock is excellent (~ 100 m thickness, TOC ~6%, HI ~600mg/g ) with an UEP of about 10 m3 of oil per m2. Assuming a porosity of ~10%, this converts to a flux of 1 m3 per million years, and a flow rate of about 0.00001 m/year for primary migration. Imagine it taking a year to move from one clay sized pore to the next! The capillary number Ca, is about 10-15, ten orders of magnitude too low for viscosity to have any effect, so no Darcy flow! Note that the GoM has one of the fastest burial rates in the world, and most basins will have rates 10 times slower.

Figure 2. Typical burial history from deep water of Gulf of Mexico basin. The main generation window occurs over about 10 million years.

Similarly we can infer rate of secondary migration or charging, again with an example of a large accumulation and fast generation rate.  A one billion barrel field filled over 10 million years equates to 100 barrels (16 m3) per year. Even if the charge is occurring over a 1 square meter area (which is unrealistically too small), the rate is still slower than typical glacier, and 4 orders of magnitude too slow for Darcy flow. 

A related question is whether oil generation is fast enough to create micro-fractures. If we take the 1 m3/my rate generated, and calculate how much volume is generated per unit rock volume, we come to 1/100/1000000 = 1e-8 m3/year per m3, or 0.01 cc/m3/year.  A drop is 005 cc, so one drop every 5 years. You see where I am going. 

Flow Mechanism


On a related subject, some authors have suggested that Darcy flow be used to explain/model the higher saturation in some source rocks. I think it is just a misunderstanding of Darcy behavior. If we examine the geology of these source rocks, such as the Eagle Ford shale, the higher saturation in these source rocks is a result of the source rock being sandwiched in between tight limestones which act as seals. The source rock needs to build up saturation (higher local capillary pressure) to exceed the seal capillary entry pressure for primary migration. In areas where the seals are not present, the saturation is very low. The Eagle Ford is underlain by the Woodbine sandstone in East Texas, where the Eagle ford is not a good unconventional target. The oil expelled downward into the Woodbine and migrated up dip to accumulate in the giant East Texas field. Vast majority of source rocks in the world, such as the well known CT & A source rocks in the Atlantic margins, the Kimmeridge clay formation in the North Sea, and the lacustrine source rocks in the Bohai basins are also excellent source rocks but have very low saturations shown by the fact that S1 Rock Eval extract correlates very well with TOC. It indicates that the residual oil is mostly adsorbed by the organic matter. 

Another argument against using Darcy model for unconventional settings, is that if Darcy (viscous, transient) flow is the mechanism, we would expect high saturation in source rocks in younger basins. On the contrary, most unconventional plays are in old basins, and some of which have had no deposition (and therefore HC generation) for over 100 million years.

Source rocks are not homogeneous, and there are always some inter-bedded capillary contrasts over the thickness of the source rock, so some saturation is often necessary for primary migration, and often higher in the middle due to having to overcome addition capillary barriers to reach the edge. Migration will be from high saturation toward low saturation, so both up and down from the middle of the source rock. It is not a viscosity (Darcy) effect as the capillary number is just orders of magnitudes too low. The capillary contrast within a source rock are much, much higher than buoyancy - so downward migration is pretty common. See this post on that.

Simple experiment/Analog for Migration


Here is something you can try or imagine. Take a bottle of water, walk outside and pore it on the street. It will flow down the street, may be for a few feet. Then it will stop. Right? Then take another bottle and pore it at the same spot, the water on the street will start moving again, a few feet further, and stops again.  The distance of migration is related to the amount of water you have (UEP of the source rock), and the rate is related to how fast you can pore it (rate of generation). If there is a big pot hole, it will not continue further down until it is filled. This is how I think of migration, the roughness of the street surface mimics a capillary system, with small pools and barriers between them, when additional water is added, it allows the small pools to connect and flow continues, and then when you stop adding water, the barriers between the pools will hold the water in place, and flow stops.